
Ever look at an offer’s “Earnings Per Click (EPC)” and think, “Okay… but what does that mean for my traffic?” If you’re a content creator, email marketer, or media buyer, this process is vital for any Affiliate marketing campaign, whether you are driving Organic traffic or using paid methods. You don’t need a perfect forecast. You need a repeatable way to estimate earnings per click before you spend weeks writing, or thousands testing ads.
This guide gives you a beginner-friendly spreadsheet model that still holds up for advanced comparisons. It won’t predict the future, but it will stop you from guessing.
What Earnings Per Click (affiliate EPC) really means (and why it can mislead you)
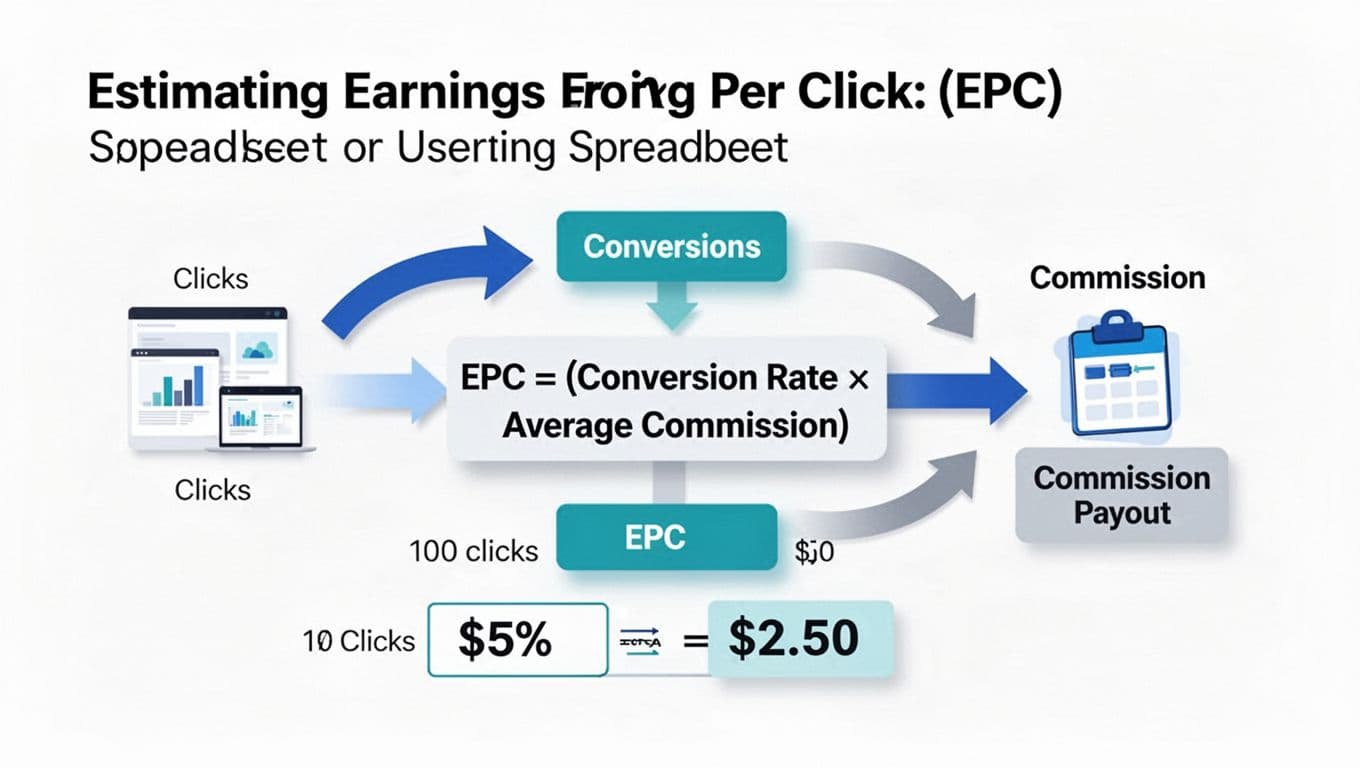
At its simplest, Earnings Per Click (EPC) is a foundational affiliate marketing metric showing how much you earn per click you send to an offer.
Understanding the concept of affiliate EPC is crucial for optimizing your marketing strategies.
A clean “back-of-napkin” EPC formula looks like this:
EPC = Conversion Rate (CVR) × Net Commission per Sale
Think of it like fishing. Clicks are casts, conversions are bites, commission is the size of the fish. EPC tells you the average “fish per cast,” in dollars.
Why Network EPC numbers don’t always match your reality
Affiliate network offer pages often show Network EPC as a blended number across many affiliates, traffic types, and regions. That can be useful, but it can also hide what matters most to you:
- Traffic source: email clicks usually behave differently than cold social clicks.
- Device and geo mix: payouts and conversion rates can swing by country and mobile vs desktop.
- Landing page optimization: tweaks here can dramatically shift your Earnings Per Click (EPC) from network averages.
- Attribution rules and cookie windows: short windows can lower what you actually get credited for. If you want a plain explanation, see this cookie window explained guide.
So instead of trusting a single Network EPC number, estimate your own with assumptions you can edit.
A simple Google Sheets or Excel model (column names, formulas, and examples)

This model calculates Earnings Per Click (EPC) and works whether you’re doing SEO content, email, YouTube, or paid traffic. Use one row per offer, per traffic source, or per step in the sales funnel (your choice).
Spreadsheet assumptions (quick disclaimer)
These are estimates. EPC varies by season, audience fit, compliance, landing page speed, and tracking. Results aren’t guaranteed, and you should expect your real numbers to move.
Exact column names and formulas (Sheets and Excel friendly)
Percentages can be entered as 5% or as decimals like 0.05. Sheets stores 5% as 0.05 under the hood, so formulas behave the same.
| Column name | What you enter | Formula (row 2 examples) |
|---|---|---|
| Clicks | 1000 (e.g., impressions x Click-Through Rate (CTR)) | (input) |
| Conversion Rate (CVR) | 3% (or 0.03) | (input) |
| Average Order Value (AOV) | 120 | (input) |
| Commission Rate | 30% (or 0.30) | (input) |
| Refund/Chargeback Rate | 8% (or 0.08) | (input) |
| Bonus per Sale | 0 | (input) |
| Net Commission per Sale | (calculated) | =(C2*D2*(1-E2))+F2 |
| EPC | (calculated) | =B2*G2 |
Notes:
Net Commission per Saleis where refunds and bonuses get priced in.- If your program pays a flat Cost Per Action (CPA) instead of a percent of AOV, swap
C2*D2for your flat payout.
Copy-paste sample table (example inputs plus calculated EPC)
Paste this into Sheets, then replace the assumptions with your own numbers. Tracking total clicks and total earnings provides the building blocks for good marketing analytics.
| Offer | Clicks | Conversion Rate (CVR) | AOV | Commission Rate | Refund/Chargeback Rate | Bonus per Sale | Net Commission per Sale | EPC |
|---|---|---|---|---|---|---|---|---|
| Offer A (course) | 1000 | 2.5% | 200 | 40% | 10% | 0 | 72.00 | 1.80 |
| Offer B (software) | 1000 | 1.6% | 90 | 30% | 5% | 10 | 35.65 | 0.57 |
How the math works on Offer A (using decimals):
- Gross commission per sale = 200 × 0.40 = 80
- Net after refunds = 80 × (1 – 0.10) = 72
- Earnings Per Click (EPC) = 0.025 × 72 = 1.80
If you want more spreadsheet ideas for tracking earnings over time, this guide on a Google Sheets affiliate earnings tracker is a helpful companion.
Make Earnings Per Click (EPC) realistic: refunds, tiers, bonuses, recurring, and traffic costs
The fastest way to get burned in your affiliate marketing campaign is to model a happy path Earnings Per Click (EPC). These add-ons keep your spreadsheet grounded.
Accounting for refunds and chargebacks (the silent EPC killer)
Refund rate belongs inside your net commission, not as an afterthought.
If your gross commission is AOV * Commission Rate, then:
- Net after refunds =
Gross Commission * (1 - Refund Rate)
Some programs also reverse commissions weeks later. Pair this math with due diligence on high-paying affiliate programs. A practical safeguard is using an affiliate program checklist before you build content or run ads.
Tiered commissions (volume-based payouts)
If your commission structure increases after you hit a threshold, you have two common approaches:
- Base case: use the rate you can reliably hit this month.
- Blended: calculate a weighted average rate.
Simple threshold formula example (put in Commission Rate cell):
=IFS(Conversions>=50,0.40,Conversions>=10,0.30,TRUE,0.20)
That requires a Conversions column. You can estimate conversions as:
Conversions = Clicks * CVR
Bonuses (one-time and performance incentives)
Bonuses come in two flavors, often tied to sales funnel steps:
- Bonus per sale: easy, add it directly (
+ Bonus per Sale). - Bonus per period (example: “$500 once you hit 25 sales”): amortize it across clicks.
Add columns:
Bonus per Period(input)Bonus per Click(calculated):=Bonus per Period / Clicks- Then EPC (with period bonus):
=EPC + Bonus per Click
Recurring commissions (subscriptions)
For recurring offers, a “one-sale” EPC understates value. A simple (not perfect) fix is expected lifetime value.
Add columns:
- Monthly Commission (input, or calculated)
- Avg Paid Months (input, your assumption)
- Lifetime Commission per Customer:
=Monthly Commission * Avg Paid Months
Then use Lifetime Commission in place of Net Commission per Sale.
Keep the assumption conservative. If you haven’t promoted the offer yet, start with 2 to 4 months, then update when you get real retention data.
From EPC to Net Profit Per Click (PPC) after traffic costs
Earnings Per Click (EPC) is revenue per click. If you buy traffic, you need the margin to achieve solid Return on Investment (ROI).
Add columns:
- Traffic Cost per Click (CPC) (input; track via affiliate link tracking for sources like Google Ads)
- Net Profit Per Click (calculated):
=EPC - CPC
A/B testing different traffic sources and lead magnet effectiveness can refine your estimates. Example: EPC $0.57 and CPC $0.40 gives Net Profit Per Click $0.17. That can work for an affiliate marketing campaign with paid traffic, but only if volume holds, tracking is stable, and risks are managed.
Quick offer comparison template (copy-paste)
Use this when you’re choosing between offers, or between traffic sources for the same offer, such as A/B testing direct linking versus lead magnets or media pricing models.
| Offer | Source (SEO/Email/Ads) | CVR | Net Commission per Sale | EPC | CPC | Net Profit Per Click | Notes |
|---|---|---|---|---|---|---|---|
If you want a bigger tracking sheet for weekly and monthly reporting, Impact’s performance metrics spreadsheet template is a solid reference.
Short checklist before you trust your EPC estimate
- I’m using net commission (refunds included), not advertised payout.
- My CVR assumption matches my traffic type (cold vs warm); landing page optimization is factored in.
- Total earnings divided by total clicks validates the EPC.
- Cookie window and attribution rules won’t obviously erase credit.
- Tiered payouts and bonuses are modeled (or excluded on purpose).
- For subscriptions, I included a conservative paid-months assumption.
- If buying traffic, I’m looking at Net Profit Per Click, not EPC alone.
Conclusion
Affiliate offers don’t need mysterious math. Earnings Per Click (EPC) stands as the most critical affiliate marketing metric for forecasting. When you model affiliate EPC in a spreadsheet, you turn “maybe” into a clear range of outcomes, and you can compare offers without hype. Start with a base case, add refunds and traffic costs, then tighten assumptions as real data comes in. Applying these formulas to every affiliate marketing campaign ensures long-term profitability and removes the guesswork from offer selection. Your next offer decision gets a lot easier when each click has a price tag.